We have been learning about gathering and presenting information.
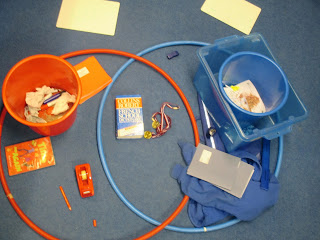
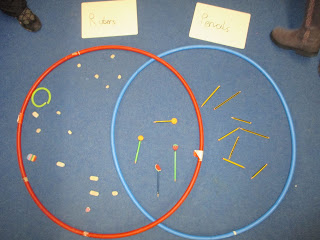
We made Venn diagrams using hoops and items from the classroom.
Red things/blue things
Yellow things/books
Pencils/rubbers
We have looked at various typed of graphs, charts and diagrams that are used to display data.
In class, we chose a topic that we wanted to gather information on. After asking our peers and collating the results, we decided on the type of graph that would be most suitable.
The Market Research Team for Swadge have even made graphs on the laptop to represent some of our findings.


No comments:
Post a Comment